There is no one “best” technical indicator as different indicators may be more or less effective depending on the specific market conditions, the type of asset being traded, and the trader’s individual strategy and risk tolerance. However, some of the most commonly used technical indicators among traders include:
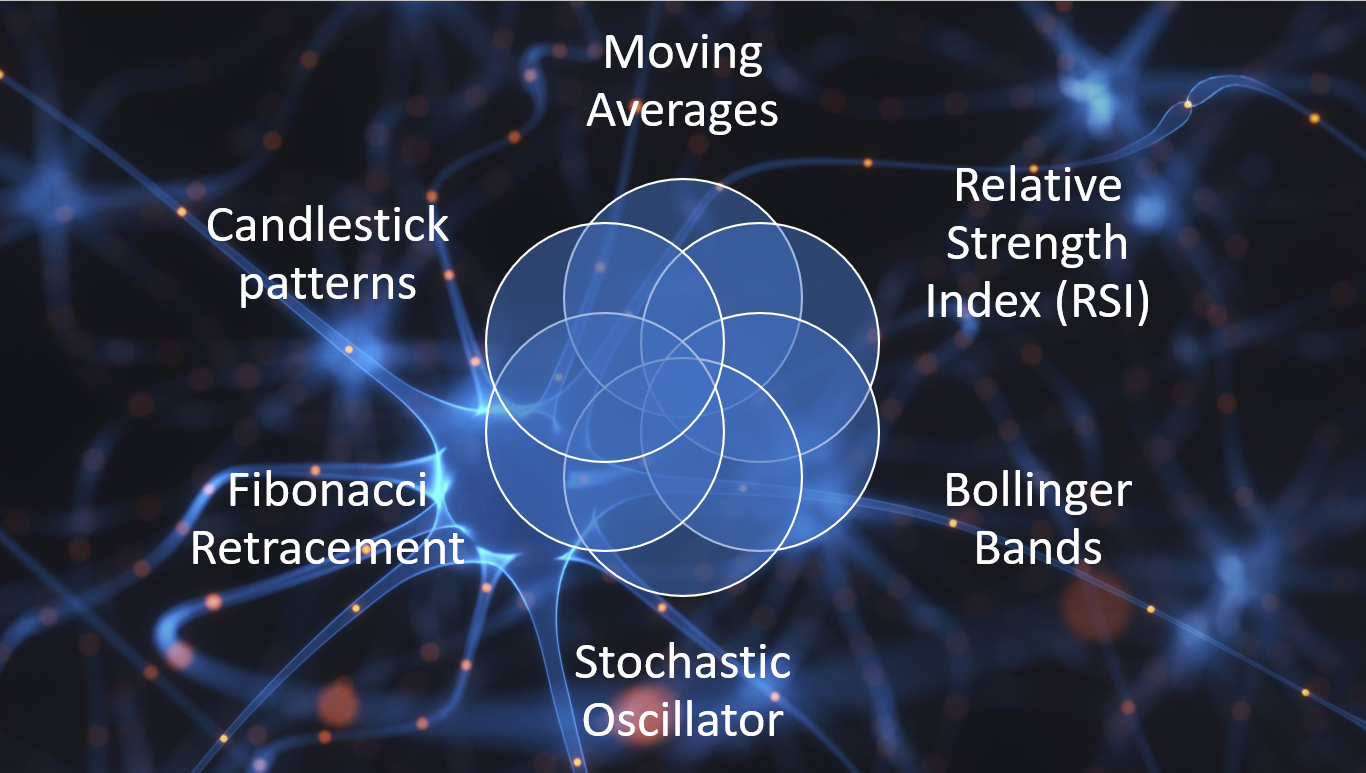
- Moving Averages: It’s a trend-following indicator that assists in smoothing out price action by averaging past prices. Moving averages are commonly used to identify trends and generate buy and sell signals.
- Relative Strength Index (RSI): It is an oscillator that helps in determining overbought and oversold conditions by comparing between the extent of recent losses to recent gains.
- Bollinger Bands: Bollinger Bands are a volatility indicator that includes a moving average and two standard deviation lines that are plotted above and below the moving average. They are used to identify potential overbought and oversold conditions.
- Stochastic Oscillator: It’s a momentum indicator that draws comparisons between the closing price of the security to the trading price range of the respective security for a particular period. The indicator is used for identifying potential oversold and overbought conditions.
- Fibonacci Retracement: Fibonacci Retracement is a popular tool among traders that uses horizontal lines to indicate areas where the price may experience support or resistance.
- Candlestick patterns: Candlestick patterns are graphical representations of the price action over a certain period, they are used to identify potential trend reversal or continuation.
In essence, it is worth mentioning that using a single indicator alone may not be sufficient, and traders often use a combination of indicators to get a more comprehensive view of the market.
Additionally, technical indicators should be used in conjunction with fundamental analysis, market sentiment, and other forms of research before making trading decisions.